Chlorinated Solvents Market 2010 in better shape after turbulent 2009
Methylene Chloride sales increased; Perchloroethylene sales stable
Sales of the chlorinated solvents dichloromethane and perchloroethylene totalled in 157,000 tonnes last year, an average increase of 9% compared with the previous year (144,000 tonnes). 2010 sales figures topped as well sales figures of 2008 at the eve of the economic crisis (154,000 tonnes).
Dichloromethane (DCM) sales climbed back in 2010 to 113,000 tonnes compared to 100,000 tonnes in 2009 as a result of the economy recovery. The major uses of DCM stay in the pharmaceutical industry, in adhesives and as process agent. EU-wide restrictions on the marketing and use of DCM in paint stripping for consumer use became effective as of 6 December 2010. This deadline and further deadlines in 2011 and 2012 affect as well professional use allowing derogations in EU Member States under certain conditions. Industrial use is not concerned by these restrictions .
European sales figures of Perchloroethylene (PER) by ECSA member companies last year stabilized at 44,000 tonnes compared to the previous years (2009 and 2008: 44,000 tonnes) after a mayor drop of PER sales in 2008 compared to the previous year. PER remains the solvent of choice for dry-cleaning and continues to gain market share as a substitute for TRI in metal degreasing.
The absolute sales of Trichloroethylene (TRI) can no longer be reported according to Cefic statistics rules that at least 3 companies are participating. The decline of trichloroethylene (TRI) sales continued after the more stringent carcinogenicity classification for TRI introduced in 2002. This classification triggered as well the identification of TRI as Substance of Very High Concern and its inclusion in the Candidate List as the first step of the authorisation procedure under REACH. Dow Europe, the Romanian producer Chimcomplex Borzeşti and the British importer Banner Chemicals have all signed a voluntary Industry commitment to ensure safe use in metal degreasing by stopping supplies of TRI to companies that are not equipped with closed systems after 2010. Industry will request exemptions for the use of TRI in closed systems.
Western European market for chlorinated solvents 2004-2010*
(Based on ECSA sales data and Eurostat import figures, excluding intra-company transfers and captive use).
| Year | Dichloromethane (tonnes) |
Trichloroethylene (tonnes) |
Perchloroethylene (tonnes) |
TOTAL (tonnes) |
| 2004 | 133,000 | 33,000 | 54,000 | 220,000 |
| 2005 | 132,000 | 28,000 | 56,000 | 216,000 |
| 2006 | 134,000 | 25,000 | 55,000 | 214,000 |
| 2007 | 130,000 | N/A | 52,000 | 182,000 |
| 2008 | 110,000 | N/A | 44,000 | 154,000 |
| 2009 | 100,000 | N/A | 44,000 | 144,000 |
| 2010 | 113,000 | N/A | 44,000 | 157,000 |
| Average yearly % change 2004-2010 | -2.9% | -3.8% |
-3.2% |
* The sales figures above are not comparable year on year. In 2004 ECSA collected sales data for the 25 EU Member States plus Norway, Switzerland and Turkey. From 2007 Bulgaria and Romania were added to the list.
Most read news
Organizations
Other news from the department business & finance

Get the chemical industry in your inbox
By submitting this form you agree that LUMITOS AG will send you the newsletter(s) selected above by email. Your data will not be passed on to third parties. Your data will be stored and processed in accordance with our data protection regulations. LUMITOS may contact you by email for the purpose of advertising or market and opinion surveys. You can revoke your consent at any time without giving reasons to LUMITOS AG, Ernst-Augustin-Str. 2, 12489 Berlin, Germany or by e-mail at revoke@lumitos.com with effect for the future. In addition, each email contains a link to unsubscribe from the corresponding newsletter.
Most read news
More news from our other portals
Last viewed contents
CO₂ Reduction Potential of the Chemical Industry through Carbon Capture and Utilisation (CCU)
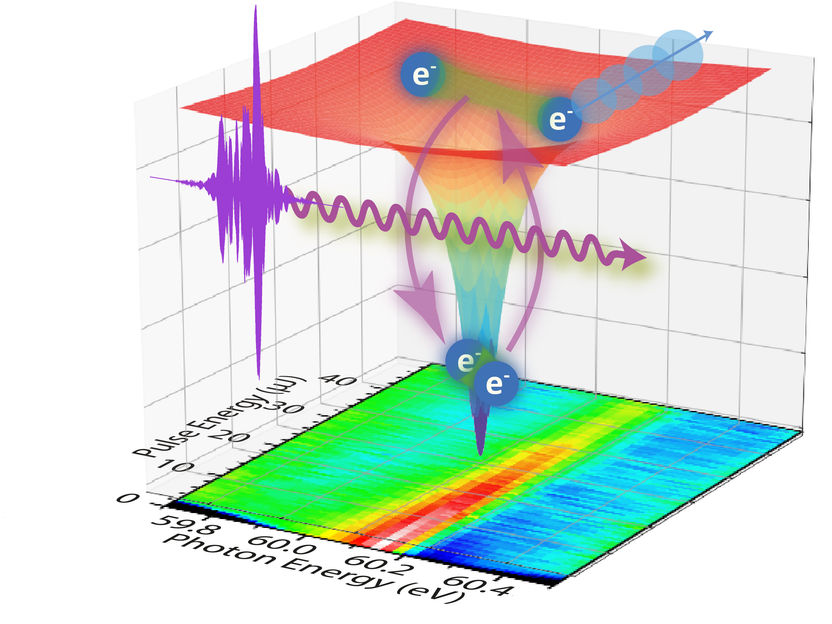
Distorted Atoms

FRAGOL AG - Mülheim (Ruhr), Germany
Shell's new polymer polyols plant at Pernis now on-stream
Quaker Chemical Corporation Announces New $100 Million Credit Facility
Eka Chemicals Island at Veracel inaugurated
New insights into how the most iconic reaction in organic chemistry really works - Diels and Alder won the Nobel; now UCLA's Kendall Houk makes the movie
New Study from Ceresana Research: Change in the Global HDPE Market
BASF increases prices for ethanolamines

Scientists home in on pairs of atoms that boost a catalyst's activity - They discovered that the messy environment of a chemical reaction can actually change the shape of a catalytic nanoparticle in a way that makes it more active
PerkinElmer announces new partnership with Pfizer Global Research & Development
