Snapshot measurement of single nanostructure’s circular dichroism
Advertisement
The 3D conformation of a molecule or nanostructure determines its function. For instance, a left-handed amino acid can be beneficial to health, while its right-handed compartment can be toxic. With today’s optical imaging techniques, one can accurately locate a molecule or a nanostructure, but resolving its 3D interior structure requires additional spectroscopic information. And, CD spectroscopy is the most widely used techniques for this purpose. If one can combine CD spectroscopy with imaging method, real-time tracking and analyzing of individual functional nano-units will become possible. It will lead to many important applications in the field of nanoscience and biology.
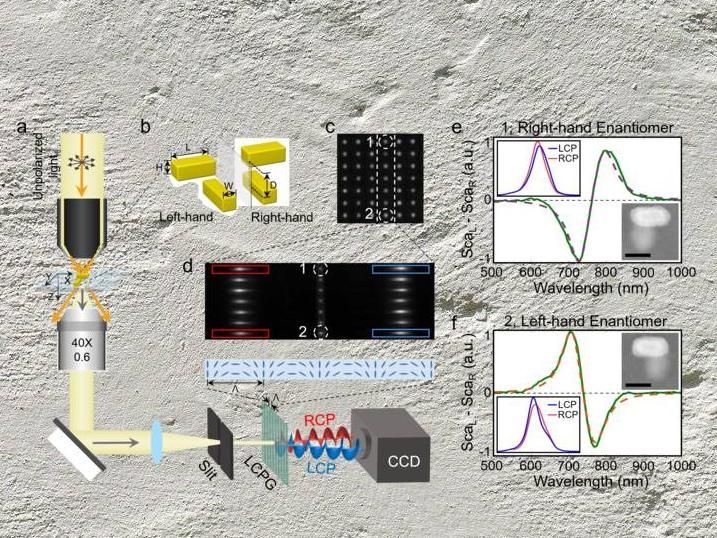
a, Schematic drawing of the LCPG-based polarization-dispersive spectrometer. The inset illustrates the director distribution of the liquid crystal in the grating. b, Structure of the vertically coupled nanorod pairs used in this work. c, Dark-field image of an array of vertically coupled nanorod pairs with different geometrical parameters. The period of the array is 3 μm. d, Spectral image of array of nanorod pairs labeled in c. The RCP and LCP components are labeled with red and blue boxes, respectively. e and f are the SCD spectra of sample 1 and 2 in c, respectively. The insets show the correlated SEM image of samples, as well as the left-hand and right-hand circularly polarized components of the scattered light of sample labeled in d. Scalebar: 100 nm.
by Shuang Zhou, Jie Bian, Peng Chen, Mo Xie, Jie Chao, Wei Hu, Yanqing Lu, and Weihua Zhang
However, current CD spectrometers rely on the polarization modulation of excitation light and require sophisticated multi-step measurements, holding the potential of CD spectroscopy from being fully released. To address this issue, in a new paper published in Light Science & Application, a team of scientists, led by Prof. Weihua Zhang and Prof. Yanqing Lu from the College of Engineering and Applied Sciences, Nanjing University, China, and co-workers developed a polarization-dispersive imaging CD spectrometry technique. The new method operates on the signals instead of the excitation light with the help of a nano-patterned liquid-crystal polarization grating (LCPG). The LCPG can disperse the left-/right-handed circularly polarized components of optical signals to different directions with equal efficiency (overall diffraction efficiency >95% at optimal wavelength), allowing us to capture the CD spectrum with a single shot. With the new technique, they studied a model system, namely the coupled plasmonic nanorod pair using the Born-Kuhn model and theoretically proved that the new method is equivalent to conventional CD spectroscopy when nonpolarized excitations are used.
The key component of the new CD spectrometer is the LCPG. Unlike the conventional polarization components which are commonly difficult to calibrate and sophisticate to use, the LCPG is simple, accurate and robust. These scientists summarized:
“The LCPG is an ideal solution for polarization-related measurements. First, its accuracy is guaranteed by theory. Mathematically, the space-variant geometric phases for LCP and RCP light generated by the LCPG are conjugated. As the result, they are always split into the ±1th order of diffractions with absolute equal efficiency.
This polarization dispersion behavior is non-dispersive, accurate and highly efficient. Secondly, the LCPG is a mature technique, and high quality LCPGs can routinely fabricated in research labs. To be honest, we were surprised to see that it worked so well in the single nanostructure CD measurements.”
Another important part of single nanostructure CD spectroscopy is how to interpret the data and retrieve sample’s interior 3D structural information. The paper studied a special case, coupled plasmonic nanorods, and showed that the geometrical parameters are explicitly related to the spectral features. Meanwhile, the scientists pointed out that the spectrum interpretation can be much more complicated:
“A single nanostructure’s CD spectrum is very different from the result of ensembles. In addition to the interior of the nanostructure, the spectrum is also related to its orientation, as well as the detailed excitation and observation geometries. To fully understand the complexity, more comprehensive theories are needed. We are currently working on it.”
Finally, thanks to the near-unit diffraction efficiency of the LCPG, the polarization-dispersive CD spectrometer is a perfect tool for weak signal measurements, e.g., the circular polarized luminescence or Raman scatterings from individual nanostructures. “Besides the plasmonic nanostructures, we also tested the polarization-dispersive imaging spectrometer with single quantum dot luminescence, and the system works perfectly. We believe that it is even capable of doing single-molecule CD measurements. That is our big goal!” mentioned by Prof. Zhang.
Other news from the department science
These products might interest you
Most read news
More news from our other portals
See the theme worlds for related content
Topic World Spectroscopy
Investigation with spectroscopy gives us unique insights into the composition and structure of materials. From UV-Vis spectroscopy to infrared and Raman spectroscopy to fluorescence and atomic absorption spectroscopy, spectroscopy offers us a wide range of analytical techniques to precisely characterize substances. Immerse yourself in the fascinating world of spectroscopy!


