Instilling order and knowledge into the flood of data
In the context of a project funded by the Austrian Science Fund FWF, a research group from the St. Pölten University of Applied Sciences has developed a versatile framework for data visualisation that permits easy integration of expert knowledge.
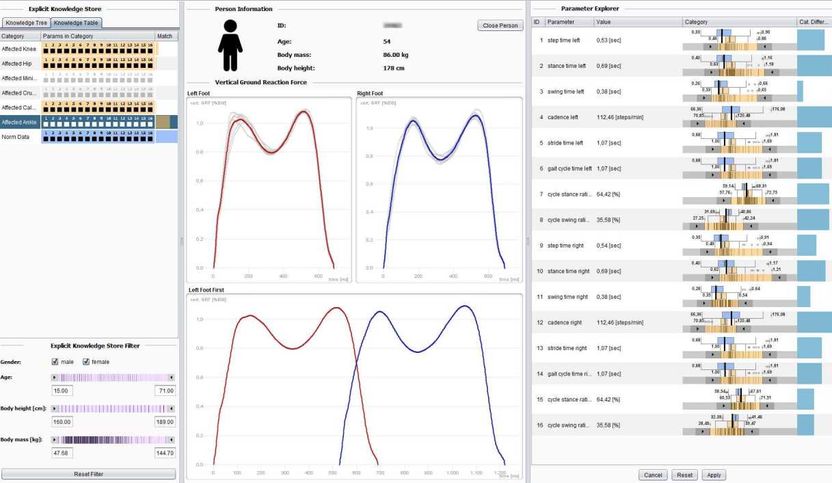
A software tool for gait analysis in physiotherapy, developed in the context of the project. To generate useful knowledge from huge amounts of data, researchers are working on interactive visualisation methods that provide an optimum combination of artificial intelligence and human expertise.
KAVAGait/Screenshot
Processing large amounts of data is one of the most important issues of our time and currently the subject of intensive research efforts. While some approaches try to control the flood of data with artificial intelligence methods, others try to organise it in such a way that humans can get to grips with it more easily. A research group headed by the computer scientist Wolfgang Aigner is working on connecting the two approaches and has now developed new methods to present time-dependent data in a comprehensible way and offer simple ways of integrating additional knowledge.
Combining the strengths of humans and computers
“We are working in the visual analytics field, where the objective is to make the steadily growing and ever more complex data volumes more manageable,” says Wolfgang Aigner. He describes a problematic information overload, which is often counterproductive: “After all, the goal is not to end up with more data, but to find an answer to something.” While automated information processing is becoming more and more central, Aigner emphasises that people are still very important when it comes to interpreting data. “We humans are extremely good at dealing with visual sensory input, correcting mistakes or supplementing incomplete data,” explains the researcher. “Computers, on the other hand, can process very large amounts of data, always at the same quality level. Computer algorithms and human information processing are thus complementary in many ways.” The idea behind visual analytics is to combine the two: “We use what humans are good at and combine it with what computers are good at.”
Integrating expert knowledge
In a project funded by the Austrian Science Fund FWF, Aigner was concerned specifically with the processing of time-oriented data, such as medical measurement results. “We started from the basic hypothesis that it should be possible to integrate at least parts of such background knowledge into the computer system and model it there in order to make it usable for human users,” says the researcher. “Previously, there had been very little research in this field”. Aigner and his team therefore worked out a theoretical foundation. “We concentrated on three things,” explains Aigner: “Descriptive power: can the model describe as large a number of existing systems as possible? Can I thus compare them systematically? Then there is the evaluative power of a framework: can I use it to make a statement about the quality of the result? For this purpose, there is a mathematical description of the model that enables quantitative comparisons. And, finally, we considered generative power: to what extent does the model support me in building new systems? Can it serve as a blueprint for something else? Our model manages to cover all three areas.”
Prototypes
Two case studies were carried out as part of the project. “We have applied the new concepts to two examples, first in IT security research, specifically in malware analysis, which is about the search for malicious software parts, and secondly in physiotherapy, specifically in gait analysis,” explains Aigner. The team developed prototypes of computer programmes for this purpose. Aigner explains the system using gait analysis as an illustration: “The patient walks over a pressure-measuring plate. Details in the heel-to-toe contact sequence are measured and the data can lead to conclusions concerning, for example, knee or hip problems.” After recording an entire step cycle, various parameters are deduced on the basis of expert knowledge using statistical methods. The aim is now to be able to add this expert knowledge to the programme in a simple manner in the course of the application.
“Let’s say I am a physiotherapist, and I know that a person with a certain combination of parameters has a meniscus problem. In our system, I can highlight the entire measurement series with the mouse and drag and drop it into an area on the screen that I have created for meniscus problems. It contains the measurement data of the people who have the same problem, and I use them to define that knowledge.” Each new data set is automatically compared with the stored datasets, and the programme will signal when it finds similar characteristics. This means that the computer analyses the data, but only up to a certain point, as Aigner explains: “It is important to note that our goal is not to automate the diagnosis completely, but only to provide support.” The diagnosis remains the responsibility of the experts.
Ease of use is crucial
Aigner focuses particularly on making sure that the tools are easy to use. “Every usability barrier is a problem for knowledge-assisted systems in medicine, information technology and other areas,” emphasises the researcher. In these fields, it is often necessary for someone to write programme code or use formal modelling methods if additional knowledge needs to be integrated. “The crux of the matter is that this must currently be carried out separately from the actual work with the tools.” As a result, it might take very long or nothing at all happens. “Our idea in the project was to make it as easy as possible for the user to integrate new knowledge while actually working — via the user interface with the mouse, using drag and drop.”
One of the two prototypes is still in practical use. “In the area of malware analysis, there was already a spin-off project during the course of the FWF project, where the prototype was adapted in co-operation with a corporate partner. They are using the programme for internal purposes.” Follow-up projects are designed to foster the application of the concepts developed and also to add “sonification”, i.e. working with sounds, to visualisation.
Original publication
Wagner, M., Slijepcevic, D., Horsak, B., Rind, A., Zeppelzauer, M., & Aigner, W.; "KAVAGait: Knowledge-Assisted Visual Analytics for Clinical Gait Analysis"; IEEE Transactions on Visualization and Computer Graphics; 2018
Wagner, M., Rind, A., Thür, N., & Aigner, W.; "A knowledge-assisted visual malware analysis system: design, validation, and reflection of KAMAS"; Computers & Security; 2017
