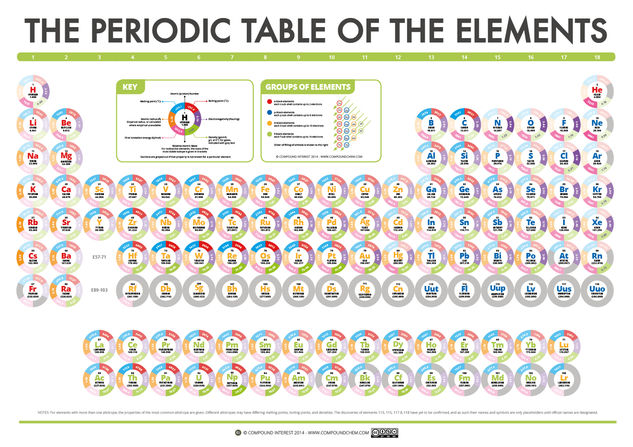
Today’s graphic is one that I’ve been working on over the past couple of weeks. Every chemistry classroom has a Periodic Table, but it’s often a drab affair; considering it’s one of the cornerstones of chemistry, I thought I’d attempt to produce a more dynamic looking version. The result is the above table – each element is shown within a circle that contains a variety of data pertaining to that element.
The data shown for each element is as follows:
- Melting point in degrees celsius.
- Boiling point in degrees celsius.
- First ionisation energy in kilojoules per mole.
- Atomic radius in angstroms.
- Electronegativity (on the Pauling scale).
- Density (in grams per centimetre cubed (g/L for gases)).


